
A Socio Case Study: Data Strategy for the Sammy Center
Introduction
The Sammy Center is a Utah-based preschool that mainly serves infants to 5 year-old children with learning, sensory, behavioral, and developmental challenges. Because many of their students struggle to engage with traditional preschools and learning centers, families often turn to the Sammy Center as a last resort for educational support. Many have been expelled from other preschools and learning centers. The Sammy Center’s approach is grounded in psychology and early childhood development research to ensure they fulfill their mission, “to provide inclusive, relationship based care for young children and their families, with a focus on connection, regulation, and belonging.” They are inclusive towards all kids who want to enroll in their nurturing environment.

This work is intense and demanding, but the results have been transformative for enrolled students and their families. The Sammy Center Director, Maria Soter, told us amazing stories about children whose behavioral issues have completely changed since enrolling at the Sammy Center. "I can tell you anecdotal stories until the cows come home. But where's the data?" For any high-energy effort, the focus is on the population being helped, and this story is not uncommon. Moving a data strategy from luxury to necessity requires help. And help often takes precious resources.
But here is the problem. Social good organizations are facing increasing pressure to report tangible outcome metrics for the work they’re doing, but sometimes organizations doing genuinely transformative work have few ways of demonstrating their impact. At the Sammy Center, they felt that the qualitative behavioral and social/emotional changes were substantial, but there weren’t great data systems in place to capture those changes.
That’s not because the Sammy Center wasn’t collecting data. Teachers and staff were taking meticulous notes on the children and their behaviors, and reporting positive experiences to parents each week. Yet, these notes were unstructured and looked different for each teacher so it was hard to create unified metrics for scoring or get a comparable view of how children were progressing. They were also using assessments and reporting systems to track negative behaviors (which they could see were receding), but reducing negative behaviors is only one aspect of the Sammy Center’s goals. They also wanted to capture all the positive behaviors these children were demonstrating as they developed social/emotional skills.
Here, we will describe how Socio was able to help the Sammy Center.
The Research Foundation
At Socio, we start every evaluation process with a literature review. We believe that every social impact project needs to be grounded in rigorous academic research describing and understanding the problem we’re attempting to solve. This allows us to build on existing expertise and start each project having familiarized ourselves with the field’s most significant research insights.
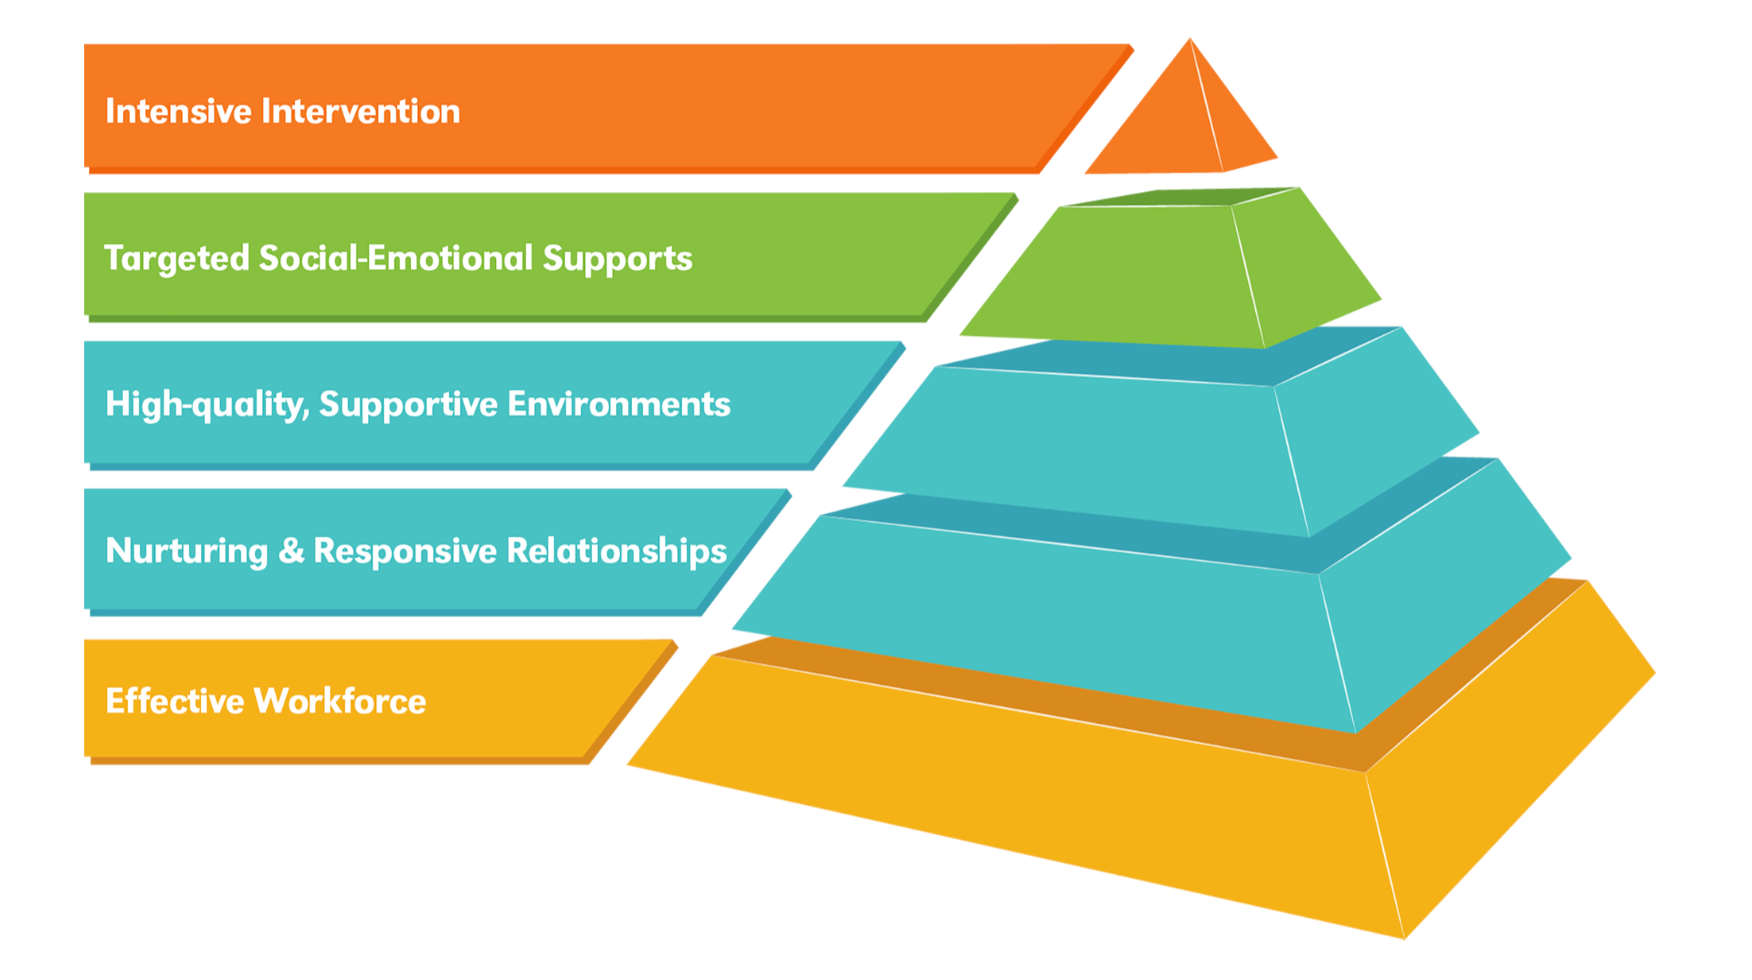
This is more than just an exercise. It turns into real value for our clients. For the Sammy Center, we could immediately identify that they were implementing the Pyramid Model of teaching for their students (Fox et al., 2003). This means that while typical academic programs are aimed at creating a Tier 2 learning environment for a general population of students, the Sammy Center is specialized in creating tier 3 and 4 environments for children with more advanced needs. This is important context because success at tiers 3 and 4 looks different from success in a typical academic program. We needed to create a data strategy that measured the specific type of academic work they’re doing and communicated that uniqueness to stakeholders.
They are also implementing a structured system of “positive childhood experiences” which the research has shown can help offset the negative impact of “adverse childhood experiences,” especially at low levels of negative exposure. As a side note, we have contributed to this research with our own recent work, (see Carson, Jones, Gibbs, Erickson, 2026). Finding a structured way to measure the impact of positive childhood experiences required us to understand how those experiences have been measured in the past and what outcomes could look like in an academic setting.
Diving into the academic literature on this subject also allowed us to choose the best measurement tools for a Sammy Center data strategy. We focused on instruments aligned with the goals of the Sammy Center that also had strong psychometric properties including internal consistency reliability (Cronbach's ɑ = .75-.95) and construct validity in preschool populations, meaning they can consistently measure what they claim to measure in children like the ones the Sammy Center serves.
Establishing a Rigorous Theory of Change
The next step of our process was to map out a rigorous Theory of Change (ToC). Developing a ToC for the Sammy Center meant getting more specific about exactly how the program produces outcomes. Building on the great work done by Maria and her team, we identified that the core mechanism was repeated adult co-regulation combined with explicit emotional labeling and guided peer practice. From there, we built a three-tier outcome ladder mapping short-term wins like reduced incidents and increased emotional labeling, through intermediate milestones like independent use of regulation strategies, all the way to long-term kindergarten readiness. All the data and measurement tools we are implementing tie back to a specific tier in that ladder.
We quickly learned that the Sammy Center had a lot of “inputs,” or efforts that they expect to create change for their kids. These include a 1:3 teacher-to-child ratio with 1:1 support during dysregulation, trauma-responsive staff, structured daily routines, and active family partnership. Those inputs enable the core activities, including proactive environmental supports, in-the-moment coaching, supervised peer interaction, individualized goals with practice loops, and family alignment on shared strategies. Together these drive the “outcomes” we’re interested in like short-term behavioral changes in the first six months, intermediate gains in independent regulation between six and twelve months, and long-term kindergarten readiness.
We also identified the program’s key assumptions explicitly:
The “treatment dosage” or teaching program is sufficient to create positive change for students
The skills taught at the Sammy Center will continue even outside that environment
Teachers are applying the intervention consistently
Grouping high-needs children produces positive peer modeling rather than behavioral contagion
Each of these assumptions give us direction on where to build tests in their data strategy so the Sammy Center can know exactly where their program stands with those assumptions. This allows us to demonstrate to even the most skeptical stakeholders that real changes are occurring when the system is working, and it allows us to know if we need to change the system to work more effectively for Sammy Center students.
Creating the Evaluation Strategy
After working with the staff to understand their goals, workflows, constraints, and aspirations, we created 3 potential data strategy offerings that they could choose from. They opted for the most comprehensive system because they are fully committed to understanding their impact and collecting the necessary data to show their impact to stakeholders.
The strategy rolls out in three phases. The first establishes a validated measurement baseline using standardized instruments at student intake, student exit, and quarterly intervals. This includes the DECA-P2, a gold-standard protective factor assessment that measures Initiative, Self-Regulation, and Attachment across both parent and teacher perspectives, paired with the Strengths and Difficulties Questionnaire administered quarterly and upon intake/exit by teachers. These instruments were selected specifically because they measure the positive attributes the Sammy Center is actively building in its students, not just behavioral challenges.
The second phase adds a Quick Capture Dashboard that gives structure to the positive observations teachers were already making informally. Using a simple mobile form that takes under a minute to complete, teachers log positive behavioral moments throughout the day across four categories tied directly to the DECA-P2 protective factors. That data flows automatically to a dashboard, creating a running record of quantitative and qualitative progress that can be pulled into parent communications, quarterly reports, and funder presentations.
The third phase introduces individualized goal tracking using Goal Attainment Scaling, a methodology well suited for tracking individual goals while still allowing for some progress comparison across different students. Each child gets one to two specific, measurable goals set collaboratively by teachers and program leadership. Teachers rate progress weekly on a structured scale, and goals are reviewed and updated monthly. Over time this allows teachers to measure the kind of individual transformation narratives that are informative for donors and meaningful to families.
Creating Low-Friction Measurement Systems
The best data system in the world is worthless if no one uses it. Sammy Center employees are constantly focused on the children in front of them, and adding a significant administrative burden would have undermined their effort in working with the kids. Many data systems fail because they aren’t designed around the people who use them.
We worked directly with staff to learn how they were already collecting data and built the new system around those existing habits wherever possible. Phase 1 adds zero new daily tasks for teachers. Phase 2 adds two to three minutes per day. Phase 3 adds three to five minutes. The result was a motivated group of teachers who are genuinely excited about the new system because they helped shape it and because they see it as evidence of their own impact, not a distraction from it.
Result: A Data-Driven Social Impact Organization
The Sammy Center now has a data strategy that matches the quality and rigor of the work they were already doing. Positive outcomes that used to disappear into weekly parent emails will now be captured, categorized, and tracked over time. Standardized instruments with strong psychometric properties give donors stakeholders the rigor they need to feel confident in what the data shows. And individualized goal tracking gives the Sammy Center the ability to tell the story of each child's progress in concrete, credible terms.
Conclusion
Is Sammy making a difference? They now have a way to know for sure and an approach to reach even the most skeptical donor or policymaker. Stay tuned. We think you are going to hear a lot more about the Sammy Center in the coming years.
The broader lesson is one we encounter often. Organizations serving the hardest cases are frequently the ones with the least infrastructure to prove their impact, not because they don't care about data, but because standard measurement tools weren't designed for their problems. Closing that gap is exactly the kind of problem Socio was built to solve. If that sounds like a challenge your organization is facing, we'd love to talk. Email ben@socio-analytics.com to learn more about how we can help your organization.
Note from the Author: Even with a deep familiarity of Rossi’s Theory of Change framework and training on how to implement it, I found the Social Impact Designer (Socio’s new AI tool) extremely helpful as a thought partner in rigorously considering the theory of change for this project. It helped me identify assumptions I was missing and reduce blindspots that might have otherwise shown up in our data system.