
Spurious Correlation and Data that Lies
Numbers don't lie, but they sure do love to mislead. In our data-saturated world, we've become obsessed with finding patterns, connections, and "data-driven insights" that promise to unlock the secrets of everything from stock markets to human behavior. But here's the uncomfortable truth: data cannot speak for itself. Without context, interpretation, and critical thinking, even the most precise statistics can tell wildly misleading stories.
Enter the bizarre and entertaining world of spurious correlations—where margarine consumption predicts divorce rates, and American cheese apparently controls stock prices.
What Are Spurious Correlations?
In social science, a spurious correlation occurs when two variables appear statistically related but have no causal connection. They move together purely by coincidence, or because they're both influenced by a hidden third variable, or simply because when you compare enough data sets, some will inevitably align by pure chance.
The mathematical relationship is real—the correlation coefficient doesn't lie about the numbers. But the implied meaning? That's where things get hilariously, and sometimes dangerously, wrong.
Real Spurious Correlations
Let's look at some genuine examples that demonstrate just how absurd data can be when stripped of context:
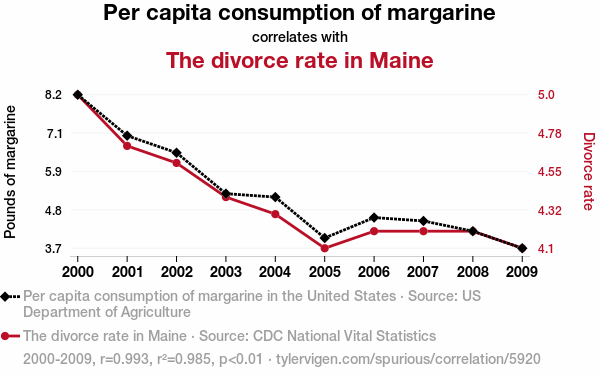
Margarine and Divorce: Per capita margarine consumption in the United States correlates almost perfectly with the divorce rate in Maine. The tongue-in-cheek explanation? Perhaps as people used less margarine, relationships became "less slippery," or maybe the lack of artificial spread kept couples from "buttering each other up." The reality? Pure coincidence dressed up in statistical significance.
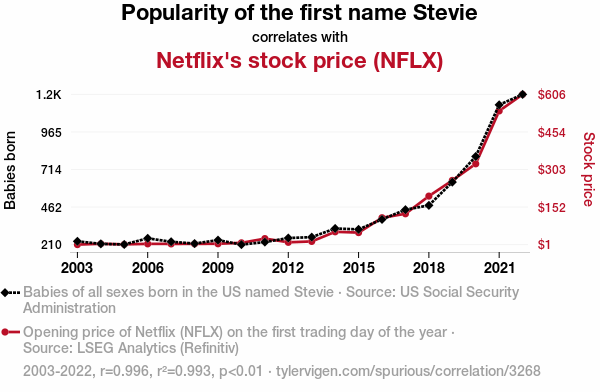
The Stevie Effect: As the popularity of the baby name "Stevie" increased, so did Amazon's stock price. The proposed mechanism? More babies named Stevie means more parents buying baby products on Amazon, driving investor confidence. The actual explanation? Two completely unrelated trends that happened to occur during the same time period.
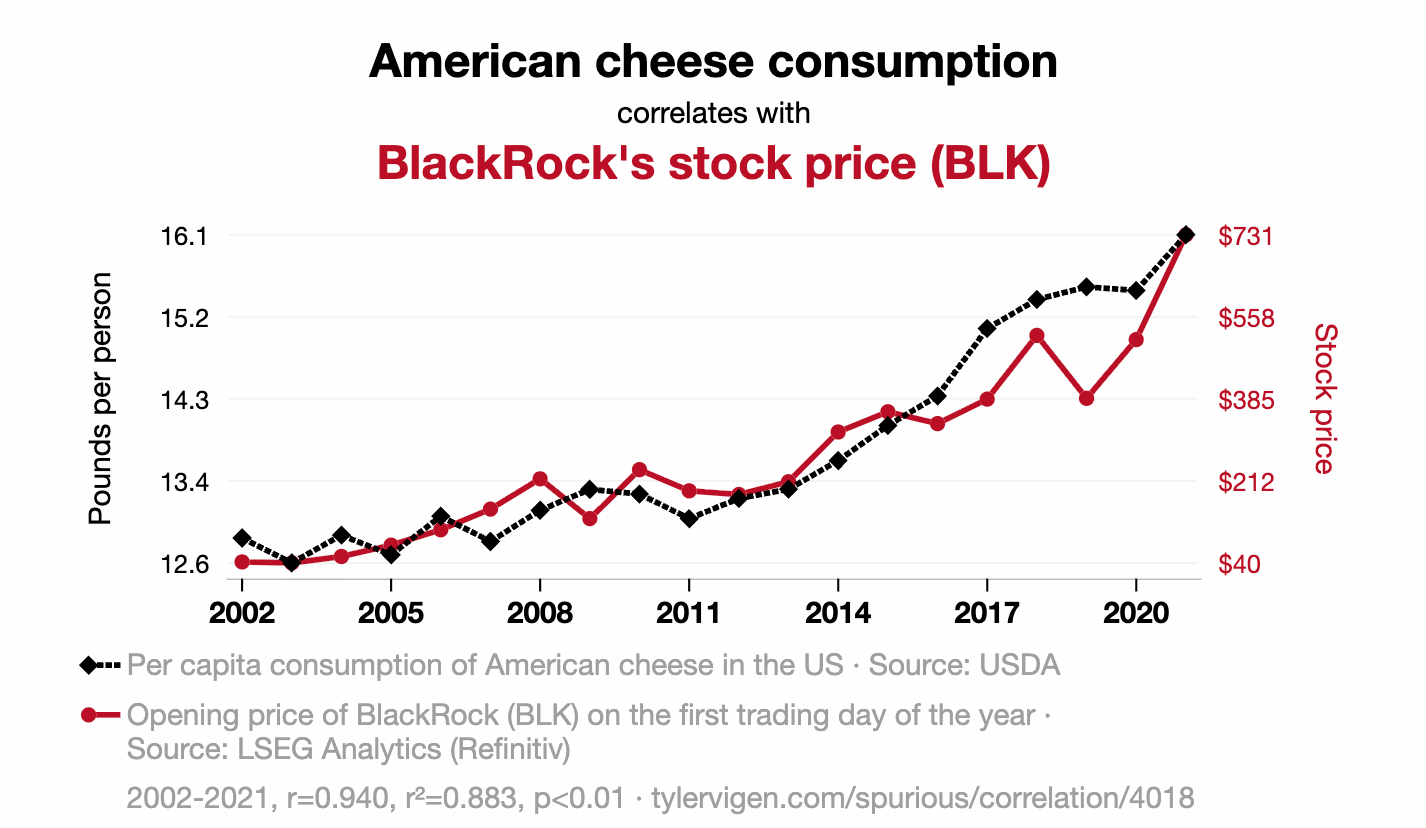
Cheese and Finance: American cheese consumption correlates with BlackRock's stock price. Apparently, eating more American cheese makes people feel patriotic, which increases confidence in the American economy, which boosts stock prices. Or, you know, both just happened to increase over the same years for entirely different reasons.
Why This Happens: The Statistical Reality
These correlations aren't fabricated—they're mathematically real. But they emerge from a practice called "data dredging" or "p-hacking." When you compare thousands of variables against each other, you're bound to find some that line up purely by chance.
It's like shuffling a deck of cards millions of times and then being amazed when you occasionally get four aces in a row. With enough attempts, unlikely outcomes become inevitable.
The technical problems include:
No causal mechanism: Just because two things move together doesn't mean one causes the other
Confounding variables: Hidden factors may influence both variables independently
Small sample sizes: Fewer data points make random alignments more likely
Time as a variable: Many things change over time for completely unrelated reasons
The Dark Side: When Spurious Correlations Aren't Funny
While websites dedicated to ridiculous correlations provide entertainment, spurious correlations in news media and policy discussions pose serious dangers.
The News Cycle Problem
Media outlets face intense pressure to generate clicks and views. A headline reading "New Study Shows Coffee Linked to Longer Life" performs far better than "Complex Longitudinal Study Finds Modest Association Between Coffee Consumption and Mortality After Controlling for Multiple Variables, Researchers Urge Caution in Interpretation."
This incentive structure encourages:
Cherry-picking results: Publishing only surprising correlations while ignoring null findings
Causal language: Using words like "causes," "leads to," or "prevents" when only correlation exists
Context stripping: Removing crucial details about study limitations, sample sizes, or conflicting research
Overgeneralization: Applying findings from narrow studies to broad populations
Real-World Consequences
Spurious correlations in news coverage can lead to:
Public health confusion: When correlation studies about diet, supplements, or lifestyle factors are reported as causal findings, people make expensive or potentially harmful decisions based on incomplete information. One month wine prevents heart disease; the next it causes cancer. The whiplash erodes trust in legitimate health guidance.
Policy mistakes: Governments and institutions sometimes implement expensive interventions based on correlational data without understanding the underlying mechanisms. If you notice that neighborhoods with more ice cream shops have higher crime rates, banning ice cream shops won't reduce crime—both are just more common in densely populated areas.
Discrimination and bias: Spurious correlations can reinforce harmful stereotypes. When demographic factors correlate with outcomes for complex sociological reasons, simplistic reporting can suggest innate rather than systemic causes.
Market manipulation: Financial news frequently highlights correlations between events and market movements, creating false confidence in prediction strategies. The "Super Bowl Indicator" (market performance supposedly predicted by which conference wins) entertains but also leads some to make real investment decisions.
The Missing Ingredient: Context
So how do we avoid falling into the spurious correlation trap? We need context:
Plausible mechanisms: Can you explain how one thing might cause another? If not, be suspicious.
Temporal ordering: Does the supposed cause actually occur before the effect?
Alternative explanations: What else might explain this pattern?
Replication: Has this finding been confirmed in different populations and settings?
Effect size: Is the relationship large enough to matter practically, not just statistically?
Data scientists, journalists, and researchers have a responsibility to provide this context. But readers and citizens need to demand it too.
The Takeaway
Data is powerful, but it's not magical. Numbers are tools for understanding reality, not substitutes for thinking about reality. Every correlation requires interpretation, and interpretation requires knowledge, expertise, and intellectual humility.
The next time you see a headline proclaiming "Studies Show X Linked to Y," pause and ask: Is this causation or just correlation? What's the proposed mechanism? What else might explain this? Who benefits from this interpretation?
Because somewhere out there, margarine consumption is "predicting" divorce rates, and butter consumption is "controlling" movie ticket prices, and the data looks absolutely convincing—until you remember that data never speaks for itself.
It always needs a human interpreter. Make sure yours is asking the right questions.